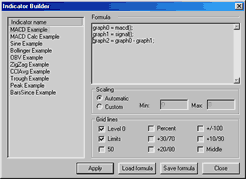
Indicator builder window enables you to define your own custom indicators. Indicators are definable using formulas written in AmiBroker's own formula language. You can find the description of this language in AmiBroker Formula Language Reference Guide.
You can define up to 2000 custom indicators which are listed on the left side of the window.
In upper right part of the window you can see the text field where you should enter the formula of an indicator.
In the bottom right part of the window you can define scaling options for the chart and the way the grid is drawn.
By default up to 3 different graphs can be plotted within one indicator window.
The formulas defining these graphs should be assigned to reserved variables
named: graph0, graph1, graph2. You can change however maximum number
of graphs by assigning different number to a maxgraph variable.
For example:
graph0 = macd();

  graph1 = signal();

  graph2 = macd() - signal();
First two graphs (graph0 and graph1) are plotted using line chart. The last
one (graph2) is plotted using histogram chart.
To find out more about using Indicator Builder please check out Tutorial:
working with Indicator Builder and Tutorial:
Using graph styles, colors and titles in Indicator Builder and working
with AFL editor.